 When I was in my 20s and early 30s, my goal was to always grow my net worth faster than the S&P 500. This is easier to do the less money you have thanks to aggressive savings. Now in my 40s, my goal is to try and earn a return equal to 3X the risk-free rate of return. With the 10-year bond yield at ~2.35%, the target return is roughly 7%.
The more money you have, the more risk averse you tend to become. At least that is my experience. Further, there’s no need to swing for the fences when hitting singles and doubles can provide for a healthy lifestyle, especially if you’ve already escaped the rat race.
For example, you can invest your entire $300,000 portfolio in the S&P 500 to earn potentially $45,000 (15%) or lose $45,000 one year. Losing $45,000 is not a big deal if you’re making a decent salary and are willing to work for many more years. But if you have a $5,000,000 portfolio and are approaching retirement, shooting for a 15% return is unnecessary because if you can comfortably live off $300,000 a year, then you only need a 6% return.
Some people have tried to make me feel bad about a 10% YTD return on my public investments when the S&P 500 is up 14% YTD 2017. But given my net worth benchmark is roughly 7%, I’m happy with the returns, especially since my private investments are doing well. I was happy when my net worth was 60%+ lower five years ago, so I’m still happy today.
In this post, I’d like to review various benchmarks you can follow to gauge your net worth performance.
Benchmarks To Gauge Net Worth Performance
* The S&P 500 Index. If you live in America, the easiest and most common benchmark is comparing your portfolio’s return with the 500 largest stocks in the country. The S&P 500 represents 14 different industries, thereby thoroughly representing the economic health of our nation. Wherever you live, just use your country’s largest stock index as a benchmark.
* Risk Free Rate Of Return Times A Multiple. The risk free rate of return is the 10-year bond yield, which changes every single day. You need to figure out a reasonable multiple on that bond yield because you are guaranteed to return the yield if you put all your money into Treasuries. What rate of return over the risk free rate (equity risk premium) do you require? My simple formula is to take the latest 10-year bond yield and multiply the figure by 3.
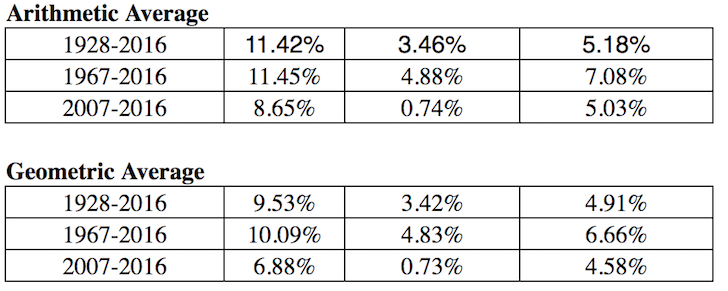
Returns of Stocks, 3 Month Treasury bond, 10 Year Treasury Bond
* Sector Specific Exchange Traded Funds (ETFs). If you work in the real estate industry and invest in REITs and homebuilders, then perhaps you should consider benchmarking your financial performance to a homebuilder ETF such as ITB, XHB, or PKB. If you work in pharma at Genentech, then consider ETFs such as PJP, IHE, XPH. If you work in finance and own your bank’s shares as part of your annual bonus, then maybe indexing yourself against XLF is a good idea. Whatever industry you are in, there is an index or an ETF for you to use.
* Consumer Price Index. The CPI is produced by the Bureau of Labor Statistics and is often maligned as an unrealistic gauge of inflation. For example, the current CPI is roughly 1.8%, but how can this be if tuition, food prices, and everything else that matters to you are soaring? The CPI should be considered the base case benchmark for everyone to beat.
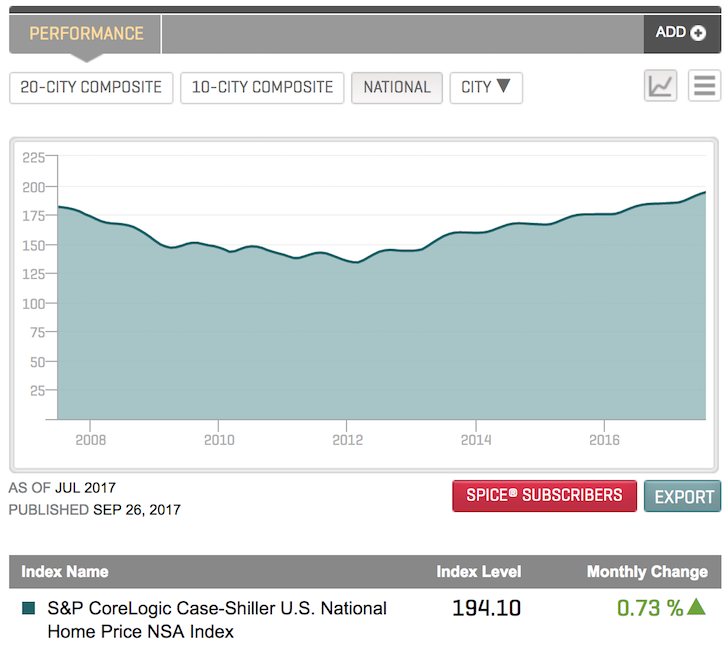
* The Case/Schiller Home Price Index. The Case/Shiller Home Price Index has risen to be the authoritative benchmark for real estate performance. The Index breaks down home price growth by region. Given we’ve discovered that a lion’s share of the median net worth in America consists of property, then the Case/Shiller Index should be a relative good barometer for the median American.
* Hedge Fund Index. Hedge fund managers are supposed to be masters of the universe. Unfortunately, in a bull market they suck a lot of wind because of their mandate to hedge. They have absolute return goals where investors expect them to continuously make money even during recessions. One of the most widely followed hedge fund ETFs is HDG. The HDG is designed to reflect hedge fund industry performance through an equally weighted composite of over 2000 constituent funds.
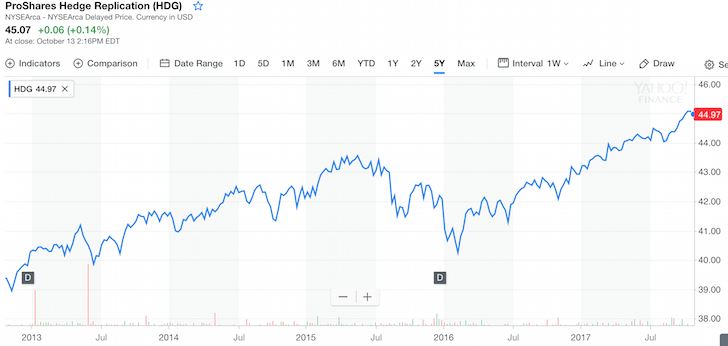
Alternative Benchmarks To Track Performance
* Your Parents Financial Situation At Your Age. Ask your parents what their circumstances were at your age. Did they own a home? A car? What was their savings level, salary, net worth? It may be a fun exercise to have a candid financial conversation with your parents. Be sure to use an inflation multiplier to get a like-for-like comparison. It could be interesting to get some subjective thoughts about their financial situation compared to yours.
* The Neighbor You Despise. Comparing yourself to your neighbor is one of the most common, yet worst ways to compare your financial situation because you don’t really know exactly how they got their money. Whenever we see a new car in our neighbor’s driveway, it’s hard not to feel envious. We wonder whether they got a great bonus at work or in my neighbor’s case an inheritance. My neighbor is 26 years old and rides a brand new $10,000 motorbike along with a sports car because he has no living expenses living at his parent’s house. His parents travel back and forth between their two houses. He probably has an embedded net worth of $2,300,000 because he will inherit his parent’s house when they pass.
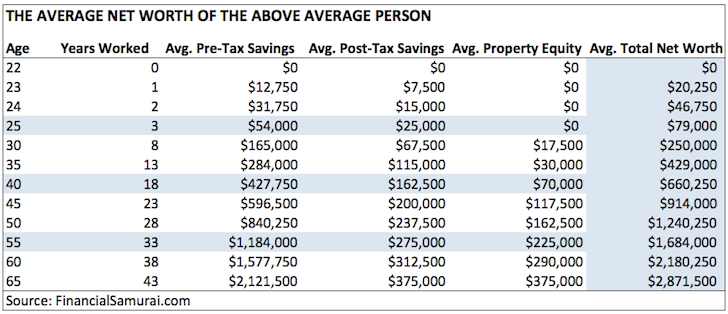
* The Average Net Worth For The Above Average Person. I firmly believe many Financial Samurai readers can and will achieve a $1,000,000 net worth by age 50 by aggressively contributing to their pre-tax retirement savings, investing an additional 20% of their after tax savings, owning a primary residence, and working on a side hustle.
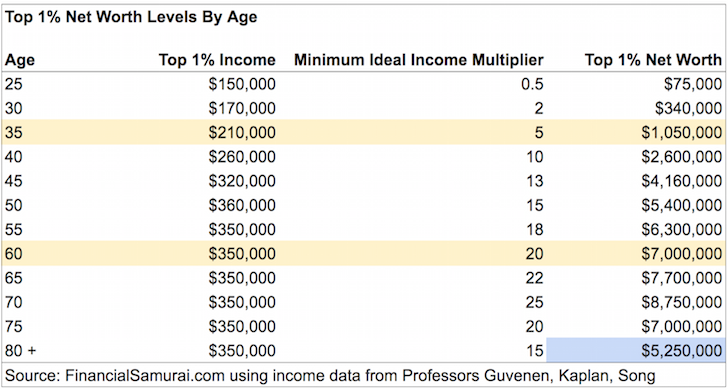
* The Average Net Worth Of The Top 1% By Age. If you’re really gung ho, then you might want to try and earn a top 1% income level for your age group, followed by a top 1% net worth as well. There are plenty of people who make a lot of money but blow it all due to a lack of financial discipline. Shoot for a $1,000,000 net worth by 35, $5,000,000 net worth by age 50, and $7,000,000+ net worth by age 60. These numbers are roughly 13% light because nowadays top one percent income is over $400,000 a year.
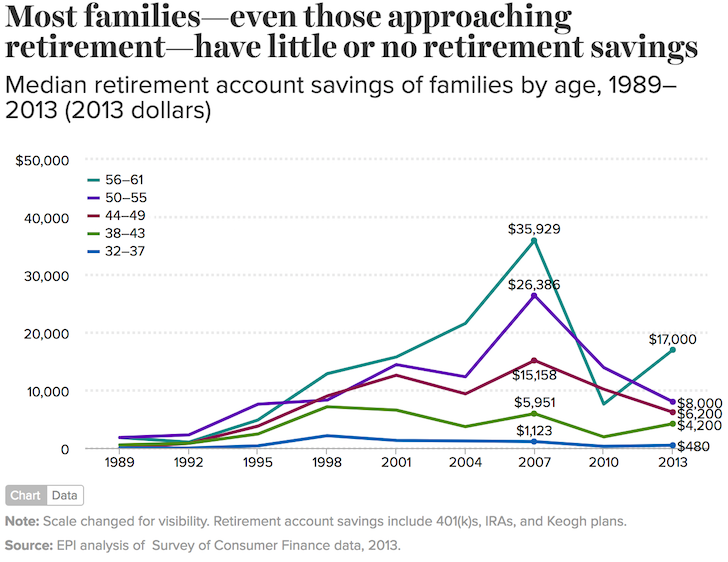
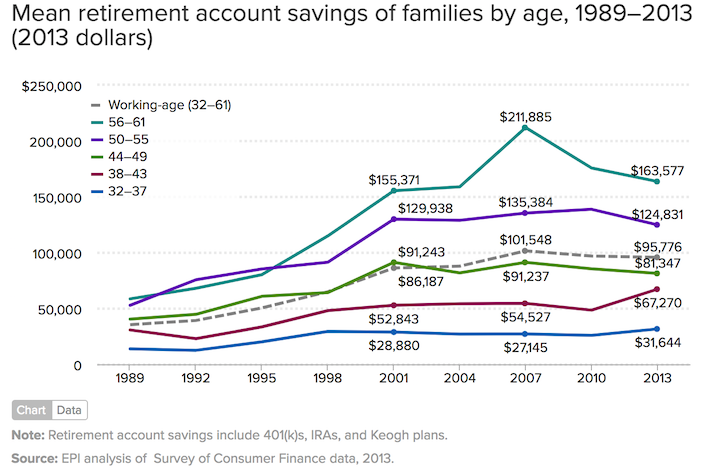
* The Median Retirement Household Savings In America. If you’re feeling unmotivated, then you can always follow the mean (average) retirement account savings of American families by age based on 2013 data. The sad part of this chart is that it’s much higher than the median retirement account savings of families by age, where the median 56 – 61 year old only has $17,000 saved. I hope you guys all agree that the below figures are not very inspiring.
Assign Meaning To Your Numbers
Having more money tends to be better than having less money. But after a certain point, more money means nothing, and can often bring about misery if too much time is spent chasing the almighty buck.
Write out your financial objectives, make a plan, track your net worth, benchmark its growth against your comparison of choice, and go about living as full a life as possible. If the numbers are good enough for your lifestyle, that’s all that matters.
Since 2012, my #1 goal has been to earn enough money from my investments and my writing to never have to work a day job again. In order to do this, I had to figure out a way to generate $200,000 a year in passive income to cover our family budget in expensive San Francisco.
Today my goal is to sustain this level for the next 22 years until our son graduates from college. This may sound daunting, but that’s the challenge I’ve set for myself!
Readers, what do you benchmark your net worth performance to? What are your main financial objectives? What other net worth benchmarks can you think of?
The post Net Worth Benchmarks To Ensure Proper Growth Over Time appeared first on Financial Samurai.

from Financial Samurai https://www.financialsamurai.com/net-worth-benchmarks-to-ensure-proper-growth/